One thing that we don’t do very well in Victoria is open transport data.
For some reason, there has seldom been a period of time over the past few decades when comprehensive, consistent and up-to-date data has been available for transport in this state. This contrasts with places like the UK, which has a dedicated agency and website for releasing, managing and updating transport data.
However, there are a few exceptions.
In 2017, PTV released a large amount of bus stop usage data for Melbourne and some regional centres. This only covered 2015-16 but is a very interesting dataset.
Unfortunately, because no comparable public data is available in the same format and with the same methodology, this provides us little more than a brief snapshot of what the bus patronage picture looks like at a particular period of time.
In early 2020, I requested patronage data by bus route. The Department of Transport generously also included updated patronage data for individual bus stops for 2018-19.
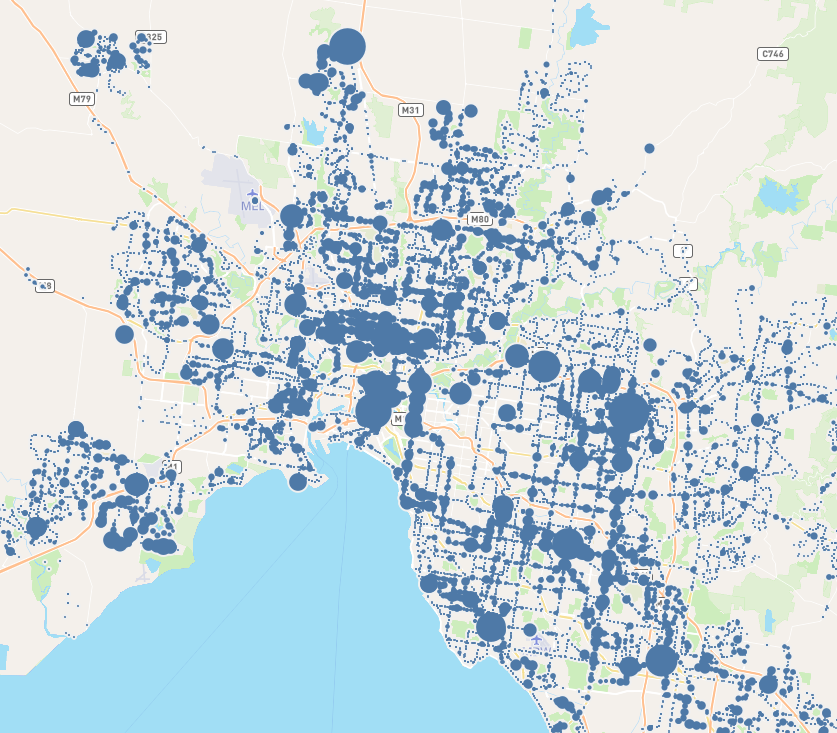
I have converted the raw data into a mappable format (see below for details) and come up with this interactive map showing daily bus stop patronage across Victoria for 2018-19. However, this didn’t break down patronage statistics into day types like the earlier data (i.e. weekday, Saturday, Sunday, public holiday and school holiday weekday). Nevertheless, it is still very interesting and I have mapped it below.
The Map
The tools used to make this map are:
- QGIS 3.4
- Tableau
- Microsoft Excel
- OpenStreetMap
- Overpass.eu
- Data.vic.gov.au
- Notepad++
The data used is in the next section below.
In a nutshell, the process to create this map was:
- Download the bus stop patronage data and bus stop location data from the Victorian Government’s data portal
- Download bus route data for Melbourne and relevant Victorian locations from OpenStreetMap using Overpass.eu
- Clean up patronage data in QGIS (I may have missed some, but there are a lot of ‘default’ myki locations for different regions of Melbourne and Victoria that I had to remove)
- Perform a geospatial join of bus stop locations (using X,Y coordinates) and patronage information
- Load new combined data into Tableau
- Styled and coded using Tableau
Some observations about the data:
- You can see the well-used trunk and orbital Smartbus routes, e.g. 200/207 through Abbotsford, 903 around the suburbs
- Station interchanges show up very easily
- High usage at Huntingdale Station and Monash University (Clayton)
- Interchanges with the route 19 tram along Sydney Road and route 86 tram along High Street/Plenty Road show up
The Data
Both the georeferenced datasheet and workbook can be downloaded directly from the bottom or top of the interactive map.
For reference, the data notes are worth reading to understand how these numbers are arrived at:
“Estimated boardings have been calculated using myki touch-on transactions from 01 July 2017 to 30 June 2019 supplemented by survey data to account for passengers who may not touch-on for various reasons. These include:
-
- Passengers having an already active, valid myki
- Faulty Driver’s Console, myki machines or myki cards
- Disruption management requirements
- Fare evasion
- Passengers with free travel authority and passengers with valid tickets who choose not to validate.
This methodology provides estimates at a macro level and is not designed to produce precise route and stop level estimates. In addition, approximately 10% of bus transactions occur on vehicles where the myki equipment is running in “headless mode”. This means that the operator is known, but not the route. Such transactions are not included here.
This document is supplied “as is” without warranty of any kind, either express or implied, including, without limitation, fitness for a particular purpose.
Stop and route data comes from EDW and was calculated as average daily patronage for Weekdays in the 2018 – 19 Financial Year”
